Wildfires 2019 (Australia)
Information as of 24 January 2020 – Report No. 1
Authors: Bernhard Mühr
1. Temperature
1.1 Temperature pattern and anomalies in Australia in 2019
In 2019, the continent of Australia experienced its warmest and driest year since recordings began in 1910. The nationwide mean temperature of the year was 21.8°C, 1.52°C above the long-term average of the reference period 1961-1990. The second warmest year, 2013, had a temperature surplus of 1.33°C.
Quite a number of other records were set, for example, the national average maximum temperature on 18 December 2019 was 41.9°C, immediately following the previous day with a temperature of 40.7°C. The previous national record for a single day’s average maximum temperature was held by a day in January 2013 at 40.3°C.
Extraordinary heat waves occurred in January and December. The months of January, February, March, April, July, October and December are all among the 10 warmest since recordings began.
In addition, new December temperature records were set in 2 federal states: In Southern Australia Nullarbor (49.9°C on 19 December 2019) is on the top of the list, and in Western Australia the new record holder is Eucla (49.8°C on 19 December 2019). Australia’s absolute temperature record, however, was not broken: It is dated 2 January 1960 and was placed in Oodnadatta in Southern Australia at a temperature of 50.7°C.
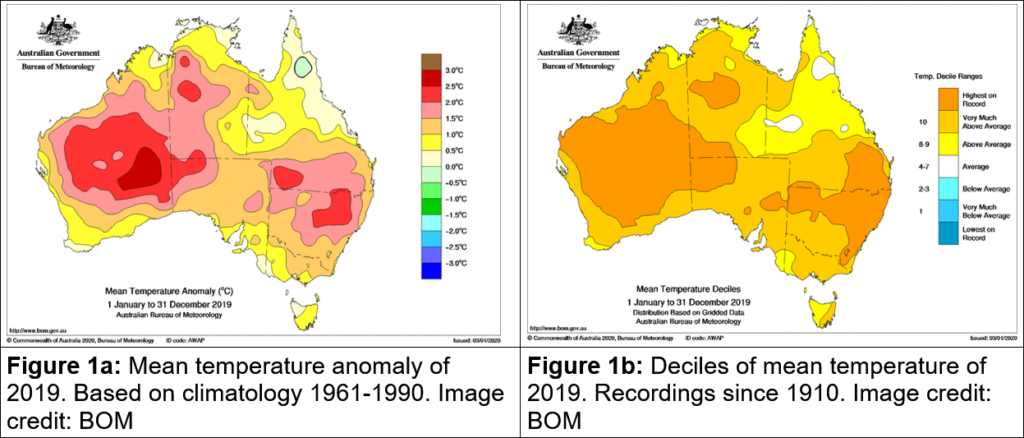
Figure 1a provides information on the deviation of the annual mean temperature of 2019 in Australia. Almost the entire country had annual mean temperatures significantly above their long-term averages of 1961-1990, with only the south of the York Pensinula remaining slightly below normal. The largest temperature surplus with a positive deviation of more than 2K was recorded in large areas of Western Australia, in some areas temperatures were even almost 3K above normal. Temperature deviations between 1.5 and 2.5 K were calculated for the northern parts of New South Wales and for the south of Queensland. Even in comparison with the annual mean temperatures since 1910, there has been no warmer year than 2019 in large parts of the country (Figure 1b). With the exception of northern Queensland, 2019 was among the warmest 10% of all years almost everywhere.
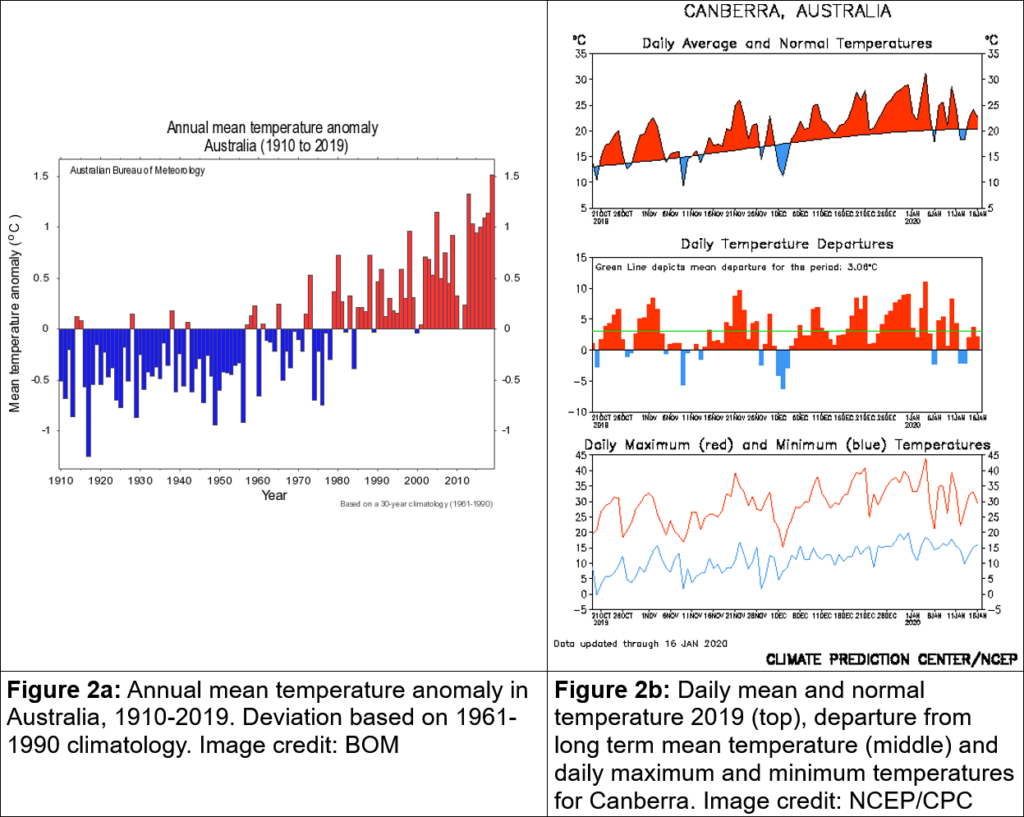
Figure 2a illustrates the enormous temperature surplus in 2019, which impressively continued the series of warm years since 2000. All years since 2013 are among the 10 warmest ever. Of the 10 warmest years, only one (1998) occurred before 2005.
The months of October, November, and December were particularly warm. In a 90-day period, the mean temperature in Canberra, for example, was more than 3 K above the long-term mean (Figure 2b). Just a few days were slightly colder than usual.
1.2 Precipitation pattern and anomalies in Australia in 2019
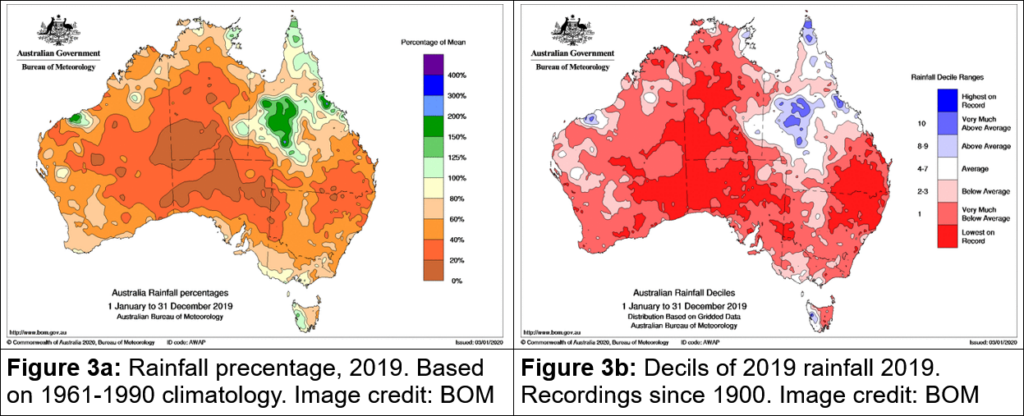
The year 2019 was characterised by a lack of rain over large areas of Australia. Only the central and northern parts of Queensland were clearly too wet; these were also the areas with the lowest temperature surplus. Their annual rainfall was between 150 and 200% related to the long-term average (Figure 3a). In much of the rest of the country, almost everywhere the year was one of the 10% of the driest years since 1900, and in the east of Western Australia, most of South Australia and the Northern Territories, as well as in northern New South Wales and southern Queensland, 2019 was even the driest year ever (Figure 3b). The greatest rainfall deficit was observed in the arid areas in the central parts of the country. Their average annual total rainfall is below 200 mm, but in 2019 rainfall didn’t even exceed 50 mm.
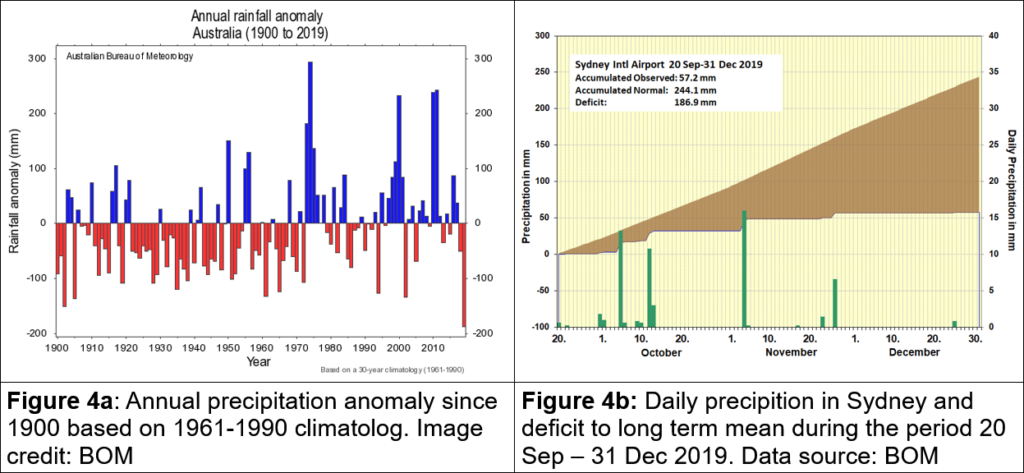
The long-term average of 1961-1990 for Australia’s annual precipitation is 465.2 mm. The year 2019 brought only 277.6 mm or 60% of the usual rainfall (Figure 4a) and thus set a new record. Precipitation levels were even significantly lower than those of the second driest year, 1902, with 314.5 mm (68% of the norm).
The regions affected by the devastating forest and bush fires, particularly in the east of New South Wales, usually receive an average rainfall between 600 and over 1000 mm and thus do not belong to the arid regions of Australia.
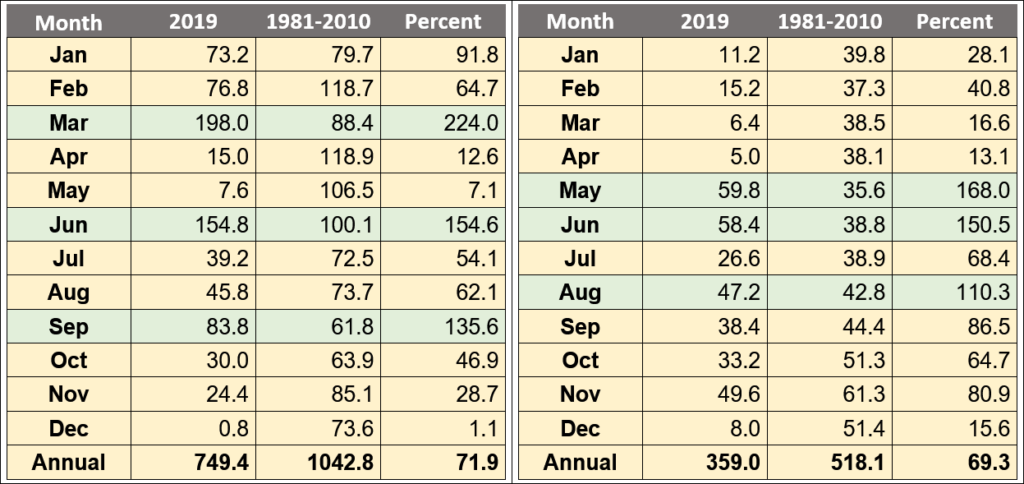
However, even there, precipitation amounts in 2019 were far below its long-term average values. Sydney measured an annual rainfall of 749.4 mm, which is 71.9% of the norm of 1042.8 mm. However, a good portion of this rainfall is due to three too-wet months, of which March in particular stands out with more than twice the usual amount. More rain than usual also occurred in June and September (Table 1, left). From 20 September 2019 until the end of the year, Sydney just got 57.2 mm of rain instead of the usual 244.1 mm, or only 23% (Figure 4b). Also in Melbourne 3 of the 12 months of the year were too wet; however, they did not nearly make up for the deficit of the other 9 months (Table 1, right). The severe drought, together with the extreme heat, facilitated the flare-up of forest fires, which began in October.
Table 1: Monthly precipitation in 2019, mean monthly precipitation (1981-2010) and percentage of monthly rain as related to mean value. Recordings for Syndey Intl Airport (left) and Melbourne Intl Airport (right)
2. Climate drivers in Australia and their anomalies in 2019
2.1 El Nino
The greatest influence on the weather and climate system in the Pacific Ocean is usually exerted by the El Nino Southern Oscillation (ENSO). As the main weather actor, this phenomenon occurs at irregular intervals, on average every 4 years.
The El Nino can have a lasting influence on the weather in Australia. Years with a pronounced El Nino typically are warmer and drier than usual in the eastern half of the continent, especially in winter and spring. La Nina phases are often accompanied by cooler and wetter weather conditions in most of the continent. In addition, the El Nino phenomenon may interact and overlap with other climate drivers described below, and the effects can be even more severe. In 2019, however, the Pacific Ocean was almost neutral and no El Nino event was observed. The main focus is therefore on the other two climate drivers.
2.2 The Indian Ocean Dipole – IOD
While in 2019 the sea surface temperature (SST) of the Pacific Ocean did not show any major anomalies and was within normal limits, an extraordinarily strong and long-lasting (positive) Indian Ocean Dipole (IOD) developed in spring. The IOD was one of the main causes of the record-dry Australian precipitation regime in 2019.
The IOD characterizes anomalies in sea surface temperature in the western and eastern Indian Ocean. The IOD index represents the temperature difference between the sea surface temperatures of both areas. The reference area in the western part of the Indian Ocean lies on both sides of the equator between Madagascar, Somalia and southwest India and is bounded by the geographical coordinates 50°E to 70°E and 10°S to 10°N. The other region is located to the northwest of Western Australia and south of Sumatra. The rectangle is bounded by the geographical coordinates 90°E to 110°E and 10°S to 0°S. A positive IOD describes conditions where water temperatures in the tropical eastern Indian Ocean are below average and the tropical western Indian Ocean SST is warmer than normal (Figure 5). Accordingly, the inverse conditions of sea surface temperatures define a negative value of the IOP index. For Australia, a sustained value of more than +0.4°C indicates a positive IOD and less than -0.4°C indicates a negative phase of IOD.
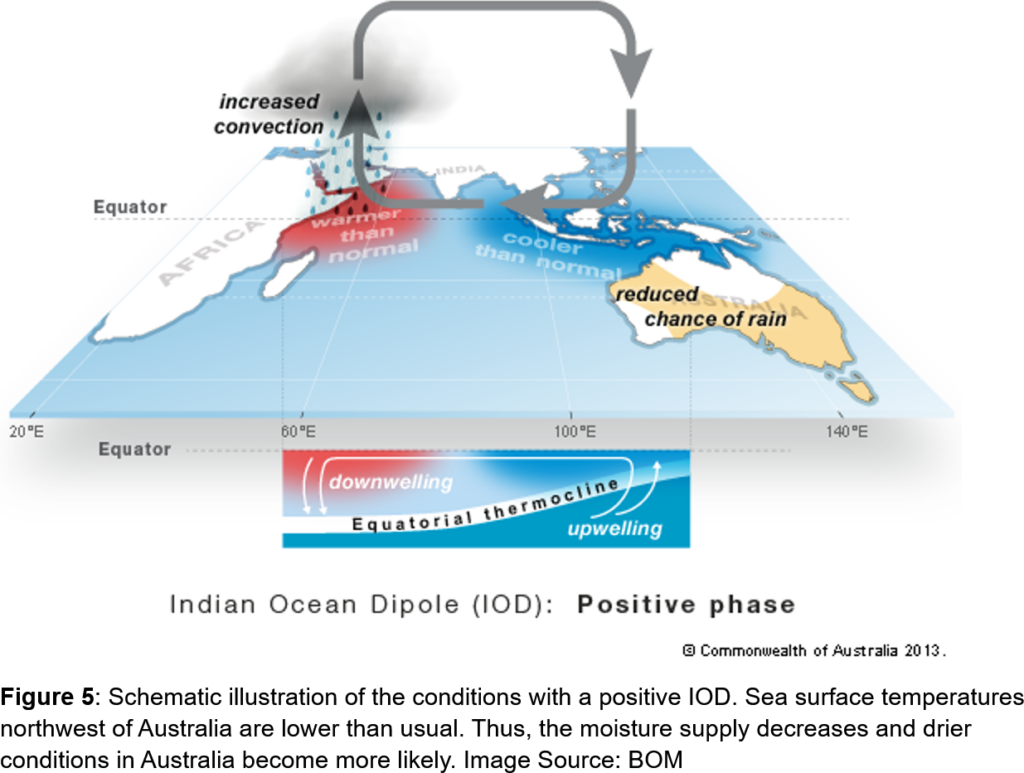
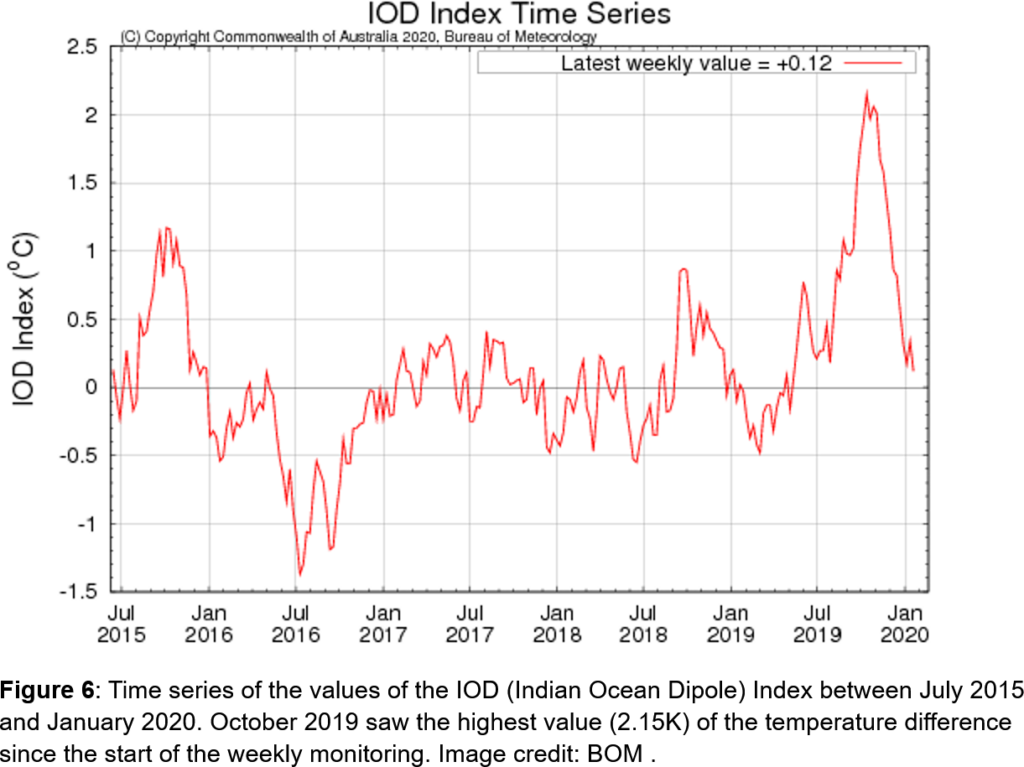
With an positive IOD, westerly winds near the equator weaken, which allows warm water shifting towards Africa. At the same time in the east, cold upwelling water is cooling the air aloft which reduces the availability of moisture. A positive IOD phase will lead to above-average rainfall in East Africa, especially in parts of Ethiopia, Somalia, southern Sudan and Kenya. In Australia, the IOP is manifested in drier conditions in most of Australia, especially during the cooler months. In 2019, the difference between the sea surface temperatures of the reference areas in the western and eastern Indian Ocean showed enormous values. During the week ending on 13 October 2019, it was 2.15 K (Figure 6). Since the beginning of weekly monitoring, such high positive values of IOD have not been recorded. The index was still well above the previous record of 1.48 K at the beginning of November 2006. As early as May 2019, when the IOD was still neutral, five out of six forecast models used by the Buereau of Meteorology (BOM) for weather forecasting indicated the evolution of a positive IOP phase in winter and lasting until mid spring.
2.3 Sudden stratospheric warming (SSW)
At the end of August 2019, a sudden stratospheric warming event began, which is comparatively rare in the southern hemisphere. At an altitude of around 30 kilometres above Antarctica, there was a 40K warming of the air within a few days. This was the strongest such event since 2002.
This SSW was associated with a northerly shift or expansion of the prevailing westerlies south of Australia towards the equator. This displacement is called Southern Annular Mode (SAM). An extension of the westerly wind zone to the north corresponds to a negative SAM, a positive SAM is associated with a southward movement of the westerly wind zone. The SAM can occur at any time and last for a week or even months.
A shift of the prevailing westerlies and its embedded low pressure areas and frontal systems could be observed from late October to December 2019. Precipitation and rainfall conditions in Australia were in line with a negative SAM, which is associated with below-average precipitation in parts of eastern Australia. In contrast, it was wetter than usual in the west of Tasmania and some sections along the south coast, which are exposed to the stronger westerly winds. In addition, the negative SAM occurred with a warmer spring and an increased likelihood of summer heat waves in southern and eastern Australia.
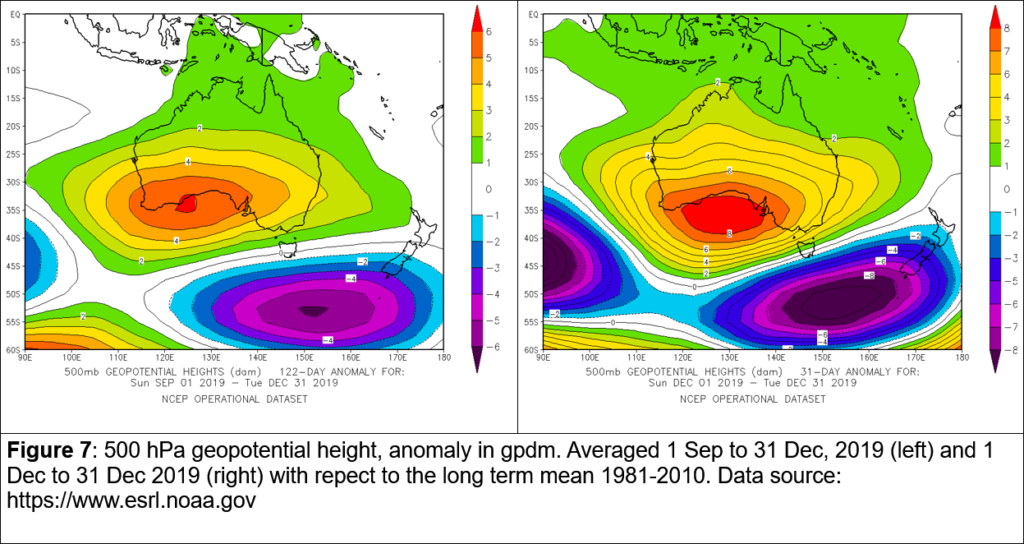
The distribution of the 500hPa geopotential anomaly shows a huge area of above average values over southern and western Australia for the period September 1 to December 31 (Figure 7 left). Even more impressive is the positive geopotential anomaly averaged over the month of December 2019, with a maximum of more than 8 gpdam over the Great Australian Bight (Figure 7 right). A large area of negative geopotential anomalies of the same order of magnitude is evident and centred around 1000 kilometres south of Tasmania and southwest of New Zealand.
3. Impacts of bushfires and dispersal of smoke
3.1 Fires as part of the ecosystem
In many semi-arid areas of the world, bushfires and forest fires are recurring events. In some ecosystems they are even important for their preservation, and many animal and plant species can only survive under the effects of fire and heat, such as the Californian coniferous forests or the Australian eucalyptus forests. The seed capsules of many eucalyptus species only open after exposure to high heat. Their seeds are released after an fire and benefit from open terrain, rich in nutrients from ashes and other residues.
Before, during and after the fires, however, persistent severe drought and heat destroy the success of reproduction even in usually dry eucalyptus forests.
Australia’s subtropical coastal rainforests normally enjoy a wetter climate and are largely immune to major forest fires. However, drought and heat in recent years, and particularly in 2019, have made the wet forests of New South Wales and southern Queensland increasingly vulnerable to fire. Even the forests of the Alpine regions have experienced massive forest fires in 2019, from which they will recover much slowlier than the dry eucalyptus forests do.
3.2 Smoke of fires in the atmosphere aloft
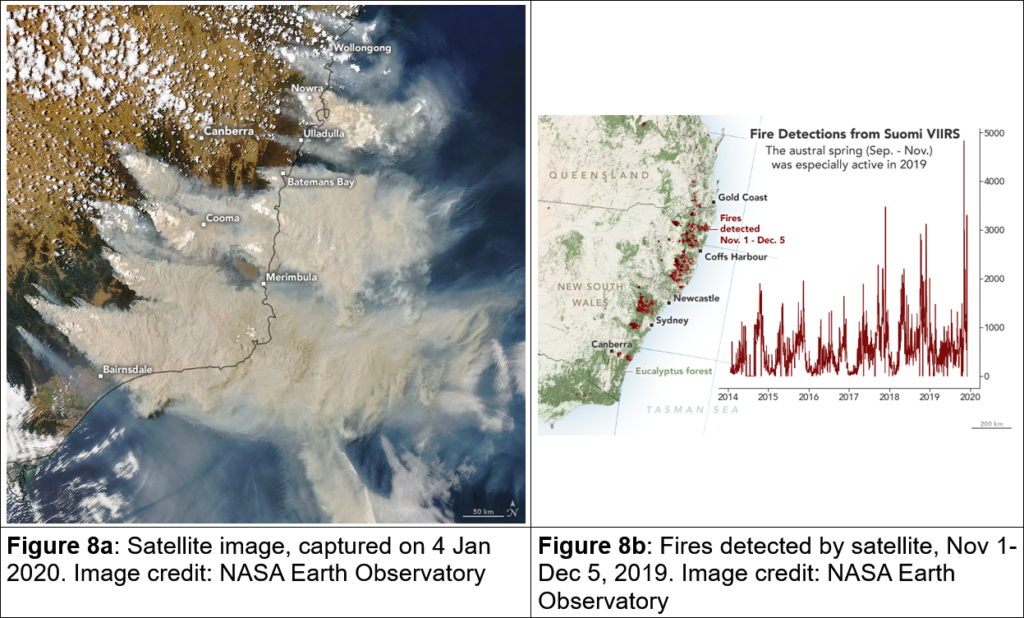
The satellite image (Figure 8a) shows the dense and huge clouds and plumes of smoke that are carried hundreds of kilometres downstream from the fire sources by north-westerly winds. In contrast to the greyish-brown clouds of smoke, normal clouds appear in bright white. The isolated bright white patches above the clouds of smoke are probably pyro-cumulonimbus clouds. They owe their formation to the rapidly rising of superheated air triggering deep convection above the fires. In Figure 8b, each dot marks a forest fire or bush fire in the period 1 November to 5 December 2019. Towards the end of the year, there were several thousand fire signatures.
Within the massive updrafts, hot rising air carried the soot, aerosols and other components to unusually high altitudes. The Cloud Aerosol Lidar with Orthogonal Polarization (CALIOP) on board the Calipso satellite detected clouds of smoke in the stratosphere at heights of 12 to 18 km on 6 January. Dust and smoke was present along almost the entire cross-section between 63 and 27°S (Figure 9). In the mid-latitudes between 48°S and 65°S highest concentrations were found between 15 and 18 kilometres, towards the equator the smoke accumulated in the lower stratosphere immediately above the tropopause in a height of 12 to 15 kilometres. In the stratosphere, these substances may persist for weeks or months.
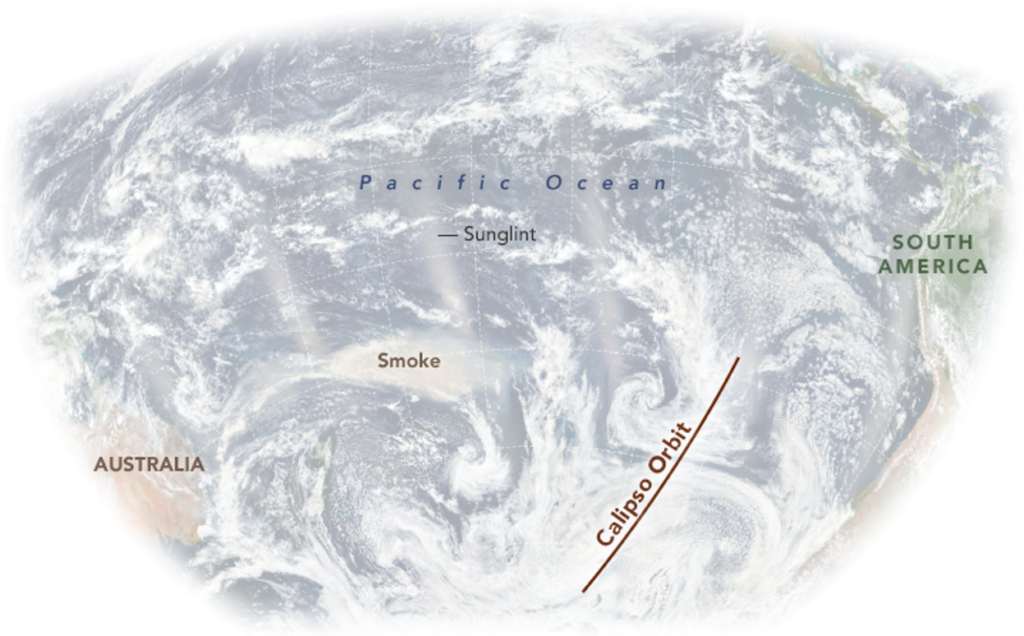
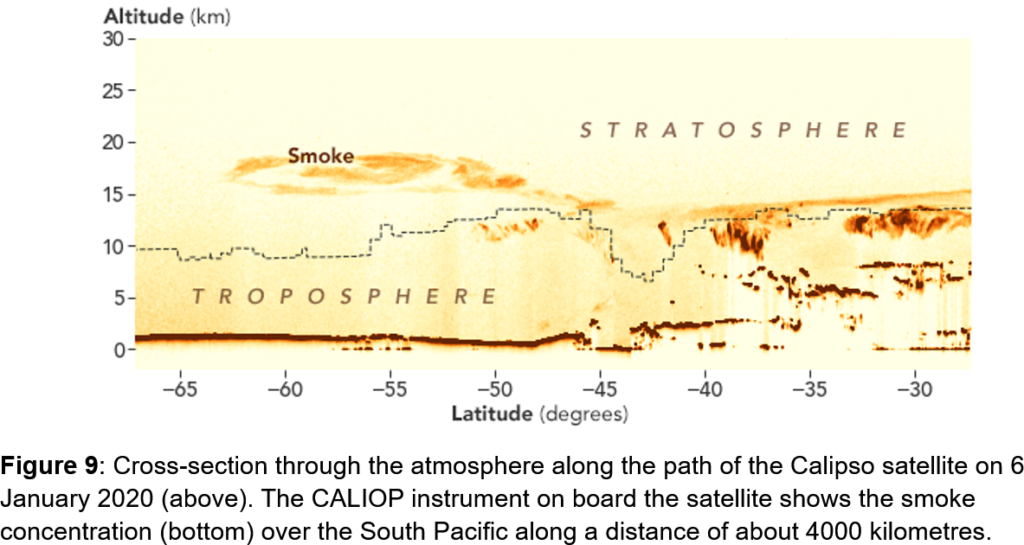
Figure 10 gives an idea of the great distance over which fire residues are transported and included into the global atmospheric circulation. The satellite image shows the brownish-grey appearing clouds of smoke and dust over the South Pacific Ocean, several 1000 kilometres east of its point of origin, where it swirls around a powerful low pressure system.
According to NASA, the smoke caused a significant deterioration in air quality throughout New Zealand. Fire residue was deposited on the snow and ice on mountain tops, giving them a visibly darker surface. Even in South America, skies were hazy and the smoke caused colourful sunrises and sunsets. The smoke probably circumnavigated the entire Southern Hermisphere at least once. According to first estimates, the fire clouds and their vertical extensiond are among the top 5 events that have ever been documented for Australia. The amount of smoke and soot released into the atmosphere is also among the largest in recent decades.
If large quantities of ash, smoke and gases enter the stratosphere during volcanic eruptions, they are always closely monitored. Especially sulphur dioxide and, as a reaction product, sulphate aerosols can lead to large-scale cooling of the atmosphere during the months following an eruption. Less well understood, however, are the effects of the fire residues on weather and climate. They have a different composition and consist, for example, more of sooty black carbon and contain less sulphates.
3.3 Smoke of fires near the surface
The fires and their clouds of smoke caused extreme air pollution and dangerous concentrations of pollutants along the coast of New South Wales and, for example, also in the greater Sydney area.
One measure of air pollution is the Air Quality Index, which takes into account air pollutants, ozone, carbon monoxide, sulfur dioxide, nitrogen oxides and other components. Air of high quality has values up to 33, a value of more than 200 is classified as dangerous and has been temporarily exceeded in the entire Sydney area. The more than tenfold concentration with a value of 2550 occurred on December 9, 2019 in Rozelle, 3 kilometers west of the Central Business District. 9 kilometers further north, Macquarie Park registered 2200. Such pollutant concentrations occur only rarely even in the most endangered cities in India and China.
Sources:
- https://earthobservatory.nasa.gov/images/145998/fires-take-a-toll-on-australian-forests?src=nha
- https://www.goes-r.gov/multimedia/dataAndImageryVideosGoes-17.html
- https://earthobservatory.nasa.gov/images/146125/explosive-fire-activity-in-australia?src=nha
- https://www.washingtonpost.com/weather/2020/01/07/pollutants-bush-fires-australia-will-circle-globe/
- https://www.smh.com.au/environment/weather/air-quality-ten-times-hazardous-levels-in-sydney-20191210-p53ins.html
- https://www.newscientist.com/article/2019-2019-was-australias-hottest-and-driest-year-on-record/
- https://www.abc.net.au/news/2020-01-02/2019-was-australias-hottest-and-driest-year-on-record/11837312
- http://www.bom.gov.au
- https://www.abc.net.au/news/2019-09-06/rare-weather-event-over-antarctica-drives-hot-outlook/11481498
- https://www.abc.net.au/news/2019-12-19/australia-heatwave-sets-hottest-day-for-second-time-in-two-days/11813446
- https://www.esrl.noaa.gov
- https://www.newscientist.com/article/2019-2019-was-australias-hottest-and-driest-year-on-record/
- https://www.thenewhumanitarian.org/news/2019/10/22/Indian-Ocean-Dipole-flood-danger-East-Africa
In Kooperation mit