Flooding in Venice (Italy/engl.)
Information as of 19 November 2019 – Report No. 1
Authors: Bernhard Mühr
1. Overview
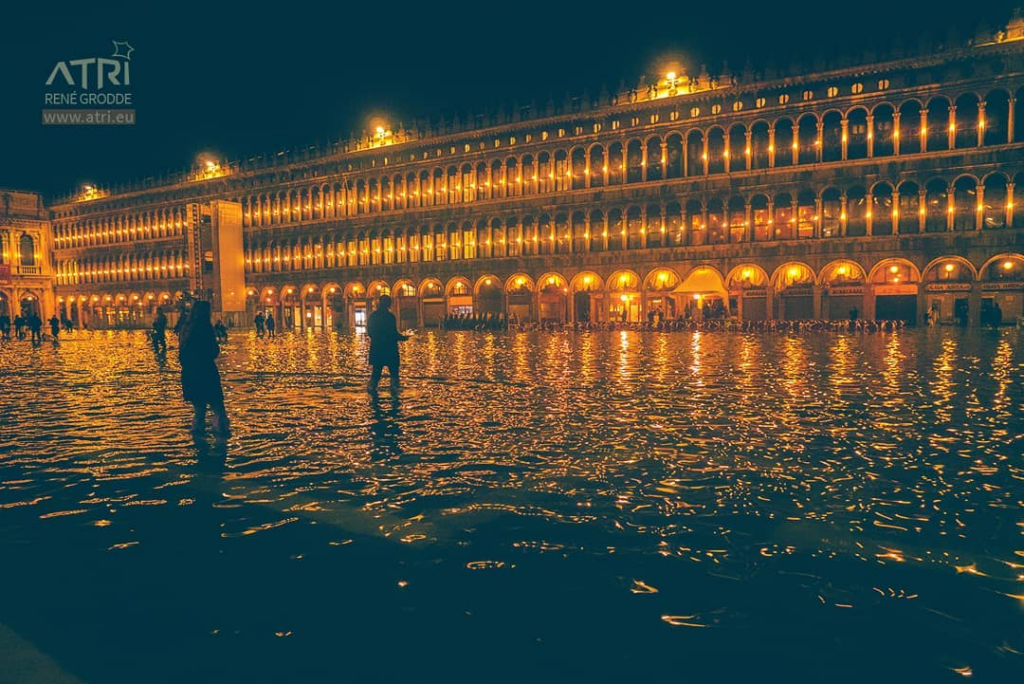
In November 2019 Venice experienced the second largest flood since 1872. The world-famous St. Mark’s Square was more than one meter high under water and also St. Mark’s Cathedral badly suffered from the flood. During the autumn and winter months, flood events frequently occur in the lagoon city; however, there has never been a series of four consecutive extreme flood events within only 5 days before.
The flood was caused by the combined effect of the astronomical tide and an exceptionally strong southeasterly to easterly wind caused by an intense low pressure system over the central Mediterranean. This atmospheric pressure and tidal pattern occurred several times in a row within few days, pushing the water from the Adriatic into the Venice lagoon and the city’s canals.
According to initial estimates, the damage is in the hundreds of millions Euros, and the repair and restoration of houses and monuments will take a long time. The MOSE system (mobile barriers for the protection of Venice from high tides) shall provide flood protection. The mobile barriers can close the three inlets which allows to separate temporary the lagoon from the sea in an event of high tide (Figure 2). The first construction work began in 2003, but MOSE is not expected to become operational before 2021.
2. General Information
2.1. The “acqua alta” in Venice
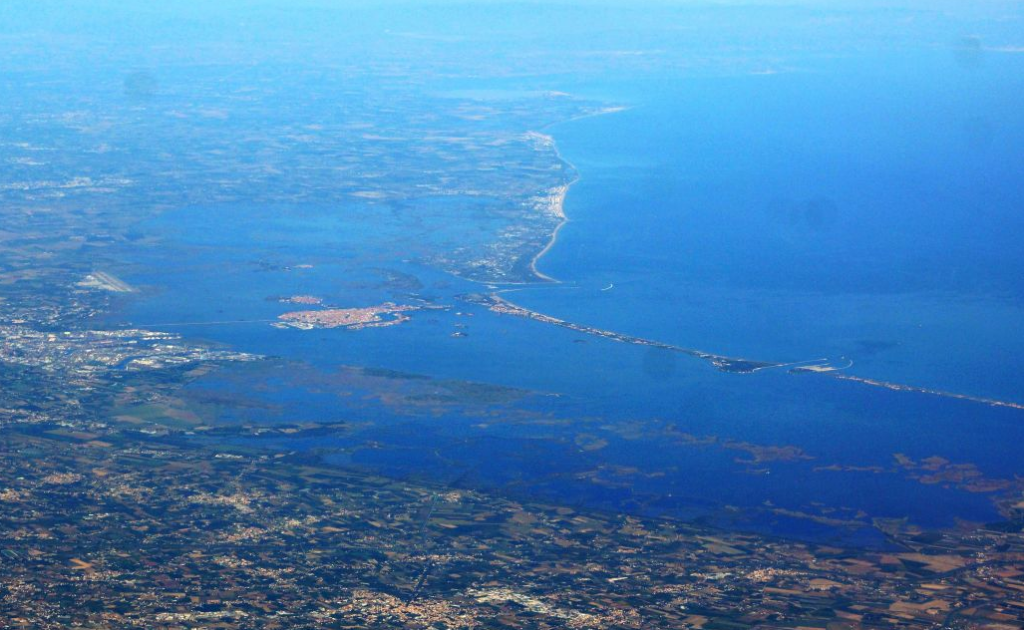
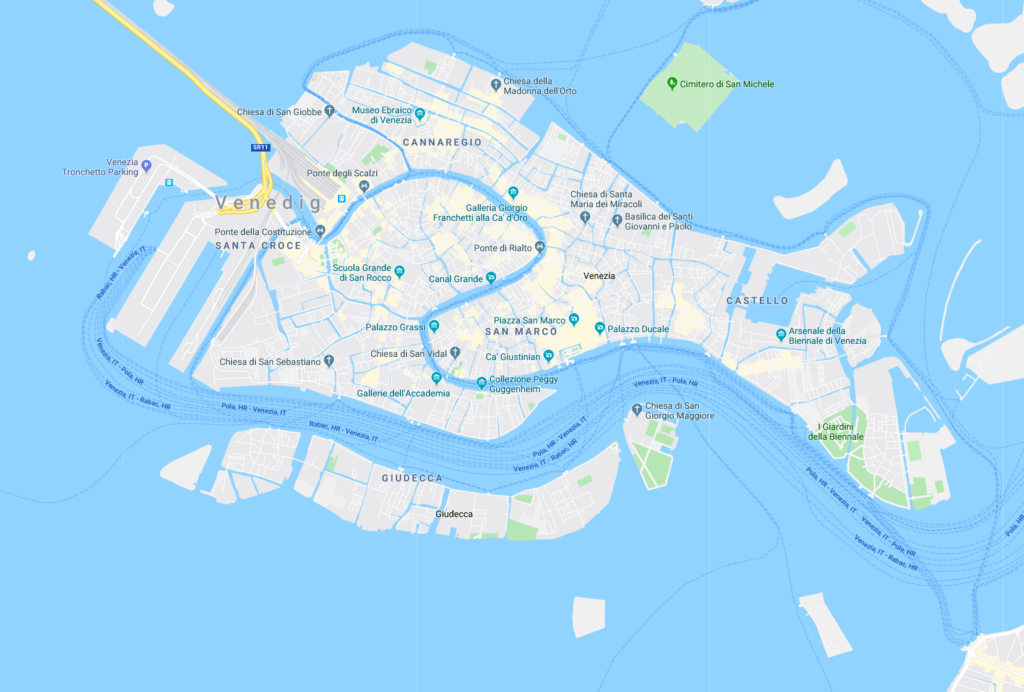
For centuries, Venice has been coping with annual floods that regularly drowns parts of the city. The floods occur due to the specific location of Venice in a lagoon, into which massive amounts of Adriatic water can penetrate under suitable wind and tidal conditions. The historical city centre, which is spread over more than 100 individual islands, is home to around 50,000 people. In addition, 27,000 people live on 118 other islands in the lagoon. Venice and its lagoon have been a UNESCO World Heritage Site since 1987 and are visited by around 20 million people every year.
In an event of an extreme flood, the normal (astronomical) tide and the storm surge caused by meteorological influences (wind, wave height, wave direction) overlap. Precipitation plays not an important role. Strong easterly to southeasterly and steady winds continue to force large amounts of water from the Adriatic Sea into the lagoon of Venice. In such cases, an extensive and strong low pressure system covers the western Mediterranean Sea and northwest Africa.
The wind, when blowing continuously from the Sahara northwards across the Mediterranean Sea and sometimes reaching storm strength is called Scirocco. This current picks up moisture from the water surface and transports warm airmasses towards the Adriatic Sea, the Balkans and the southern Alps, it is also sometimes loaded with huge amounts of Saharan dust.
If the water level at the reference point Puna Salute is 80 cm above the mean value, the so called “acqua alta” is in effect and pedestrian areas in the particularly low areas (Piazza San Marco) become flooded.
2.2. Classification and impatcs of the “acqua alta”
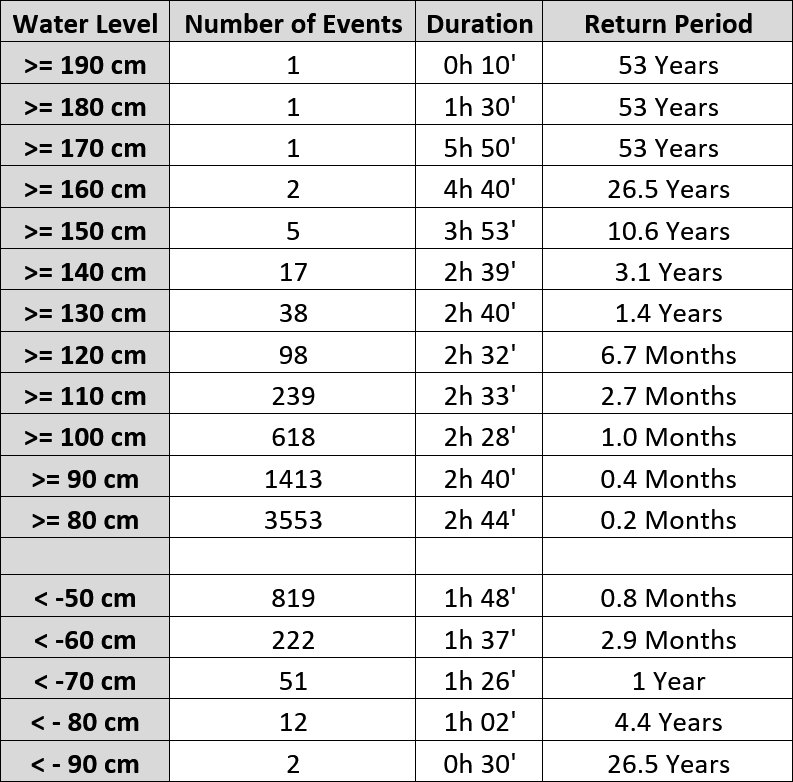
A flood event in Venice occurs when the water level at the reference point Punta Salute near St. Mark’s Square reaches 80 cm or more. A water level of at least 140 cm represents an extreme flood. The historically highest water level of 194 cm occurred on 4 November 1966. Table 1 gives information about the different flood levels. The level at Punta Salute also serves as a reference for low tide.
Table 1: Classification of high and low water according to water level. Datum is Punta Salute in St. Marks basin. Data source: https://www.comune.venezia.it
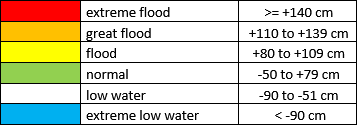
Information and warning of the inhabitants is done by sirens, which are placed throughout the city. Depending on the water level there are four signals:
- 110 cm: a prolonged sound on the same “note”.
- 120 cm: two sounds in ascending scale
- 130 cm: three sounds in ascending scale
- 140 cm and above: four sounds in ascending scale
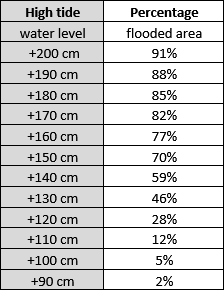
With the onset of the “acqua alta” when the water level is 80 cm at the reference point of the Punta Salute station, the lowest pedestrian areas (St. Mark’s Square) are flooded and initial transport problems occur. At a height of 100 cm, the water floods 5% of the city area. St. Mark’s Square is knee-deep under water at 130 cm and at 140 cm, an extreme flood, 59% of the city area is flooded. At 180 cm the water also runs into St Mark’s Basilica. During the historically highest flood of 1966 (194 cm), 90% of the area of the historic Venice was under water. During the night of 12/13 November 2019 (water level: 187 cm) about 87% of the historic city area was flooded. Table 2 gives information about the water level and the percentage of flooded areas in Venice.
Table 2: Percentage of the flooded area of the historic city centre of Venice at different flood levels. Data source: https://www.comune.venezia.it
2.3. Meteorological information
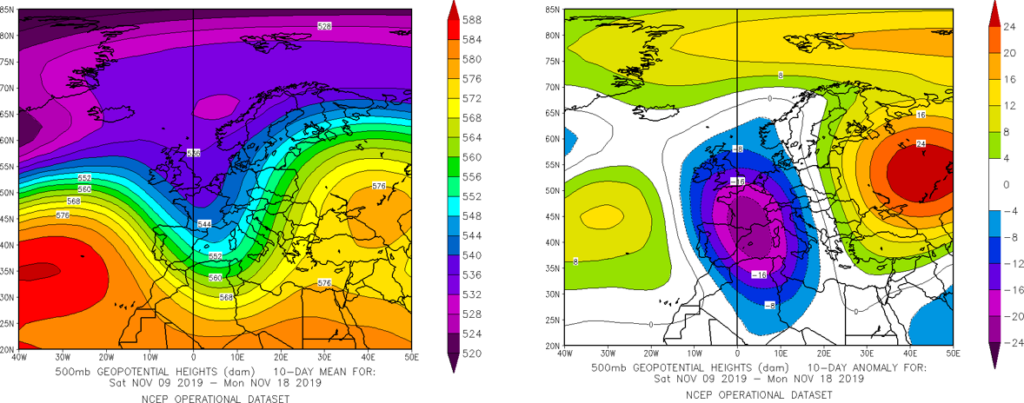
The 10-day period from 9 to 18 November 2019 was characterised by an unusually stable geopotential pattern across Europe. In the 500 hPa level, a pronounced trough appears, whose axis extends from the North Sea across France far into northwestern Africa (Figure 4 , left). It is flanked by two broad ridges, one arching over the Acores and the other stretching from eastern Europe to Finland and northwest Russia. The geopotential pattern shows an enormous negative anomaly with values of more than 20 hPa from France to the Algerian coast, the same order of magnitude is represented by the positive geopotential deviation over Eastern Europe. The 500 geopential anomalies are calculated with respect to the long-term mean 1981-2010 (Figure 4, right).
This quasi-stationary long-wave pattern in 500 hPa resultet in numerous surface low pressure systems, which repeatedly made their way into the central Mediterranean region and finally circulated over Italy. On their eastern flank, warm and humid air masses propagated northwards, triggering unusually abundant snowfalls in the southern Alps, at least at higher altitudes. In large parts of the western and central Mediterranean region the weather was very unsettled, snow fell also in Spain and in the mountainous areas of Mallorca. In Italy and on the Balkans there was excessive rain in places.
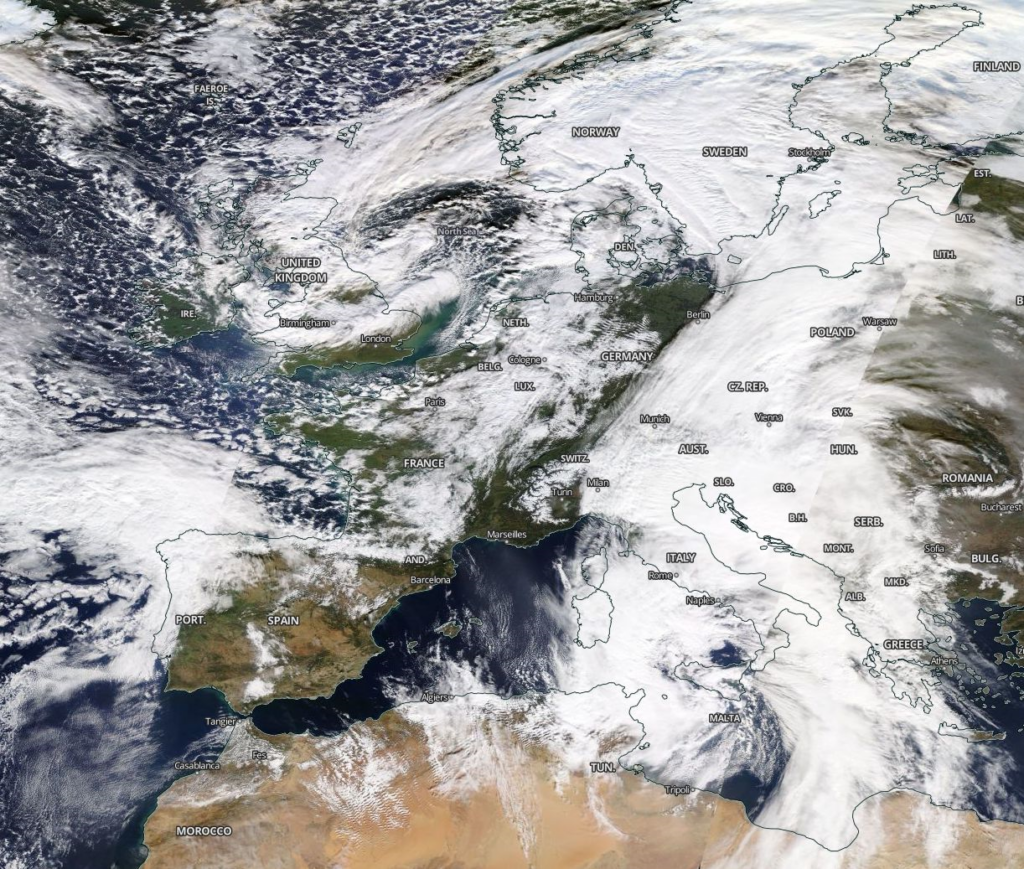
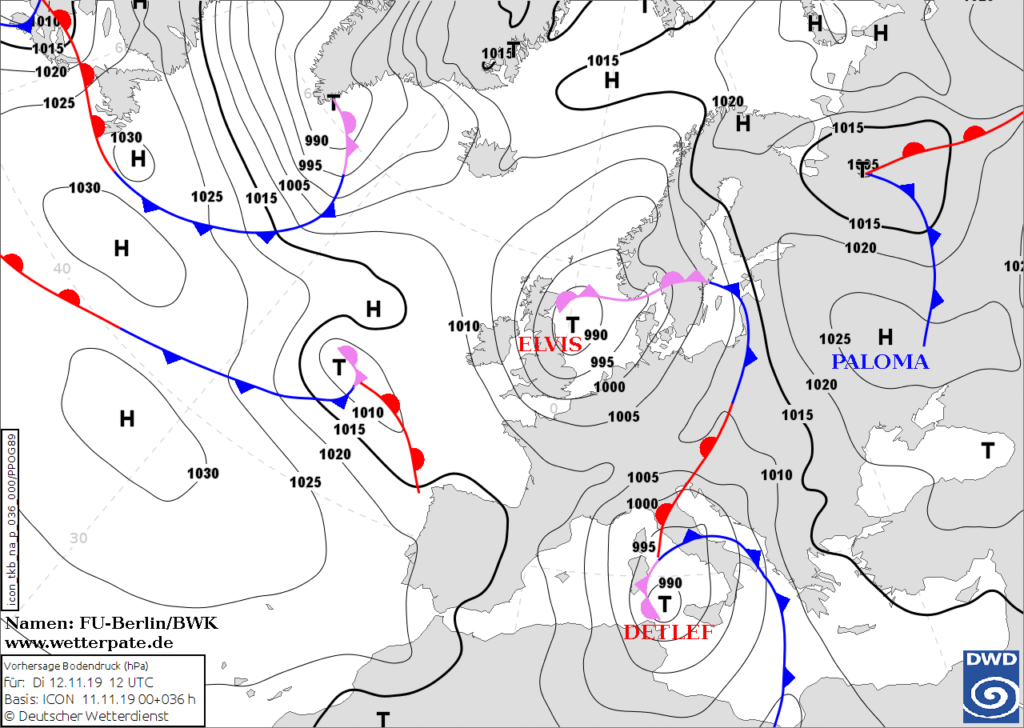
On 12 November 2019, one of these low pressure systems, called DETLEF, covered entire Italy. According to the forecast, its centre was over water between Sicily and Sardinia at 12 UTC (Figure 5). The satellite image from the afternoon of 12 November 2019 (Figure 1) shows the extensive low pressure complex over the central Mediterranean region and its cloudless centre just north of Sicily. Originating at the occlusion point of the depression, the cold front extended in a large curvature across the centre of Italy, the southern Adriatic Sea and the Great Syrt as far as Libya. With the northward shift of the low pressure area the pressure gradient over the Adriatic continued to increase in the course of the afternoon, evening and night. Over the northern Adriatic Sea the wind became strong and had south esterly to north easterly directions. With passage of the cold front the 10 minute average wind speeds was over 80 kph at Venice San Giorgio station. Neighbouring weather stations recorded wind gusts of even more than 100 kph.
2.4. Wind and high tide
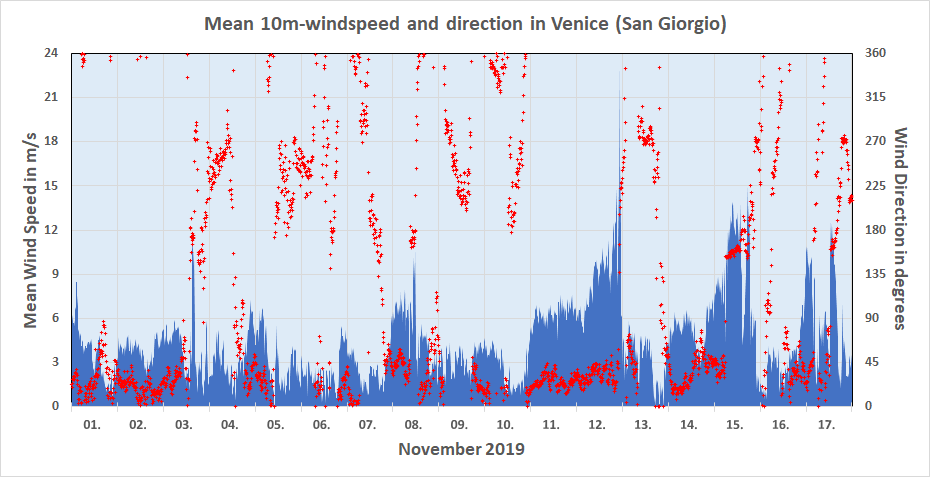
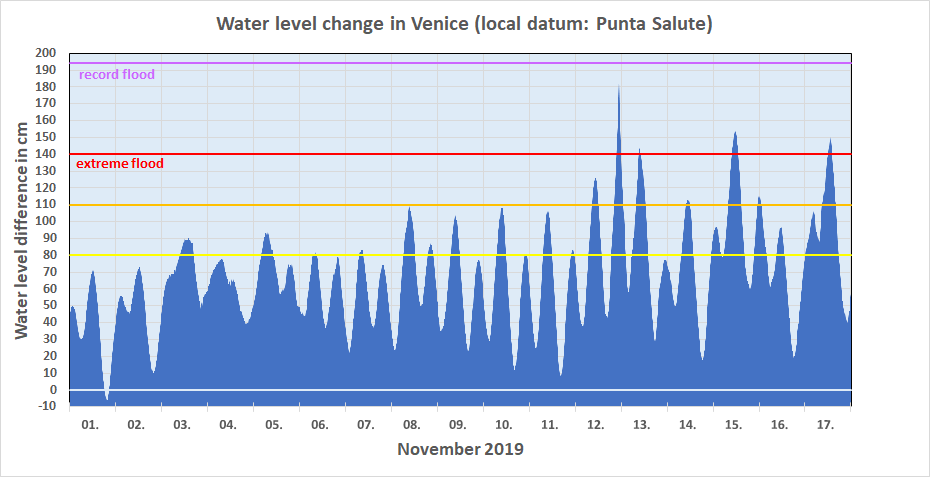
For the period of 01-17 November 2019, figure 6 gives information about the mean wind speed and the corresponding wind direction (top) as well as the respective water level in relation to the reference station Punta Salute (bottom). The recordings have been taken every 10 minutes.
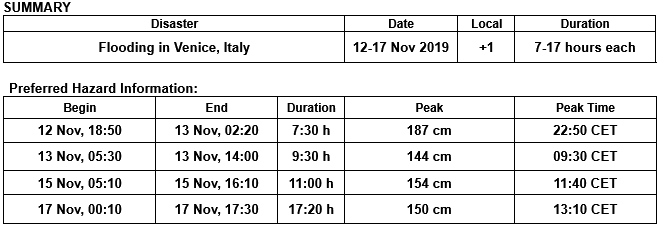
At Punta Salute, a water level in excess of 140 cm occurred 4 times in November 2019. The peak water level of all November 2019 high tides was 187 cm measured on 12 November 2019 at 22:50 CET. At the same time, while the cold front was crossing Venice, the wind reached its highest values and coincidentally the astronomical tide also passed through its apex. From the Adriatic Sea both the wind and the tide pushed enormous masses of water into the lagoon of Venice and flooded 87% of the city. However, with the sudden decrease of the wind intensity, the leap of the wind to western directions and the onset of low tide, the water ran off again quickly. The extreme high tide with water levels of at least 140 cm lasted for only 2:20 hrs. Without any wind support, the next extreme flood occurred just 12 hours later around noon on 13 November 2019, and lasted for about an hour. On 15th and 17th of November 2019 low pressure areas and their associated strong winds again were responsible for two more extreme flood events.
2.5. Impacts of the “acqua alta” in Venice in November 2019
In November 2019, four extreme flood events with a water level of at least 140 cm above the reference point at Punta Salute occurred within only 5 days. Venice has not experienced such a series of extreme flood events since 1872, in the 147 years periode 1872 to 2018 there were only 20 such events. During the night from the 12th to the 13th November 2019 the second largest flood ever observed occurred in Venice. With a water level of 187 cm, the flood remained only 7 cm below that of the highest flood of 4 November 1966.
Around 87% of the total area of the historic city centre was under water (Figure 8). According to the mayor, the damage amounts to several hundred million euros. Damage occurred not only around the world-famous Piazza San Marco, but also to numerous monuments, shops and residential buildings throughout the city. According to the Italian Minister of Culture, more than 50 churches suffered damage, and structural damage to the columns of St Mark’s Basilica is feared; the crypt was completely flooded. Venice’s famous water buses, the vaporetti, ceased operation and numerous gondolas were smashed by wind and waves at their moorings. Schools were closed for several days. Two people died as a result of the floods. The government declared a state of emergency and promised financial aid of up to 5,000 euros for flood damaged residential buildings and up to 20,000 euros for businesses. Hotels complain about numerous cancellations of overnight stays.
3. Historical Remarks
3.1. Frequency of flood events
Flooding or the “acqua alta” is not an unknown phenomenon in Venice. On average 27 times a year the “acqua alta” (water levels at least 80 cm above the reference point) occurs in Venice. However, water levels of 180 cm above the reference point are extremely rare. This happened once in 1966 and for the second time in the night 12th/13th November 2019. However, the water usually drains off quickly, the exposure time of the highest water levels lasts only a few hours.
Table 3 lists the number of all flood events since 1872 according to their water level, their mean duration and their return period. However, the return period was not determined by any statistical method, but is based solely on the observed average frequency in the respective interval in relation to the period 1872-2018.
Table 3: Accumulated number of all flood events 1872-2018 depending on the water level, the mean duration and the return period. Data source: https://www.comune.venezia.it
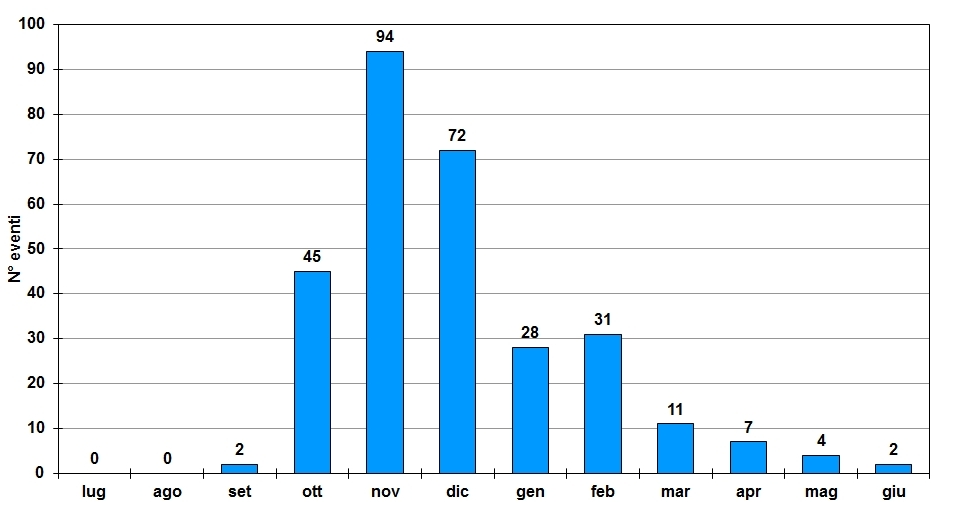
3.2. Monthly distribution of flood events
The floods in Venice do not occur evenly throughout the year. In the period from 1872 to 2018 there were a total of 296 flood events with a water level of at least 110 cm above normal. 71% of these events occur in the months of October, November and December. Together with January and February, over 90% of all events are concentrated in late autumn and winter months. The occurrence of flood events in Venice correlates closely with the presence of strong depressions in the western and central Mediterranean. These low pressure system, provding a strong pressure gradient and as a result strong and sustained winds over the Adriatic Sea with an eastern component, are almost exclusively limited to the autumn months of October and November as well as to the winter month of December. Less frequently, suitable low pressure systems develop in January and February, while during midsummer months there has never been a major flood in Venice.
3.3. Extreme Flood Events since 1872
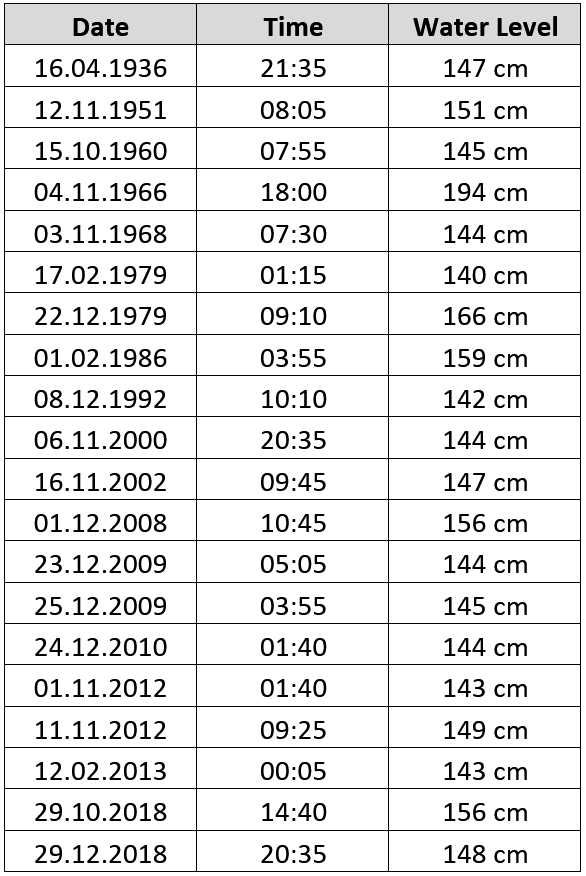
Table 4 provides information on the date, time and water level of all extreme flood events (>=+140 cm) from 1872 to 2018 in Venice in chronological order. In total, there were 20 such events in the 147 year period. The four events of November 2019 are not yet included in the list.
Table 4: Date, time and water levels of all extrem high tide events between 1872 and 2018. Data source: https://www.comune.venezia.it
3.4. Increase of the number of flood events since 1872
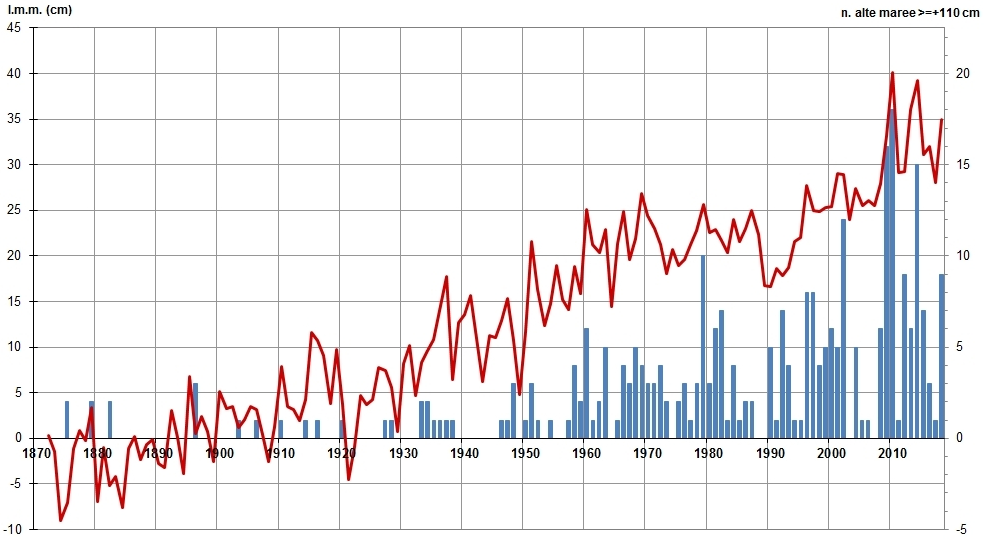
The annual mean water level (msl) can be determined by averaging the highest and lowest water levels of the year at the reference point Punta Salute in Venice. At present, the mean water level is about 30 cm higher than at the beginning of the last century. The strongest rise occurred in the years 1930 to 1970, and after about 30 years with an average constant water level, the red curve in Figure 8 shows a strong rise again since 2008.
The rise in the water level in Venice is a combined effect of the thermal expansion of seawater with rising water temperatures and underground subsidence processes, to which the city resting on piles is subjected.
Especially since 1960 there has been a significant increase in flood events. While at the beginning of the last century an average of one such event per year occurred, in recent years there have already been 5-6 events per year.
Internetquellen:
- https://www.comune.venezia.it
- https://www.bbc.com/news/world-europe-50409021
- https://www.mosevenezia.eu/project/?lang=en
In Kooperation mit